
What Is User Interaction?
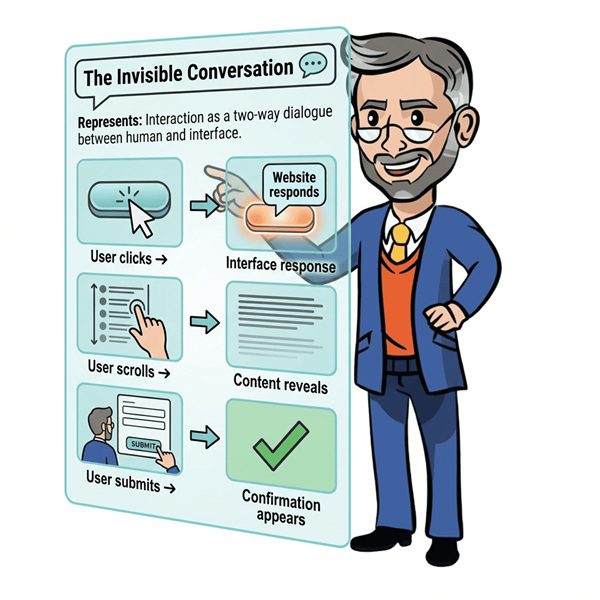
User interaction is any action a person takes on a website, app, or other digital product, and how the product responds. Clicks, scrolls, form entries, and video plays all count. In sales and marketing, user interactions are the small steps that move a visitor from browsing to buying, and you can track each one.
User Interaction in a Sentence
Our user interaction data showed 4,000 people clicked the “Buy Now” button. Sadly, it was a screenshot of a button.
Key Takeaways
- It’s a two-way exchange. The user acts, the product responds. Both halves decide whether the visitor keeps going.
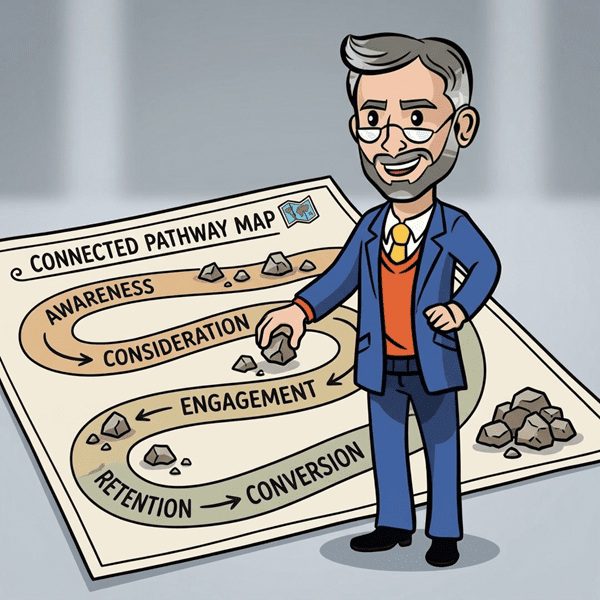
- Every sale is a chain of small interactions. Remove friction from each link and more people reach the end.
- You can’t fix what you don’t measure. Use event tracking, heatmaps, and engagement rate.
- Speed is part of the response. If a page doesn’t react fast, people assume it’s broken and leave.
How User Interaction Works
In everyday language, an interaction is any back-and-forth between two people or things. In sales and marketing, it’s the back-and-forth between a person and your digital touchpoints: your website, landing pages, emails, ads, and apps.
Every interaction runs the same four-step loop:
- The user sees something. A headline, a button, a form. This is the user interface (UI), the visible layer.
- The user acts. They click, tap, scroll, type, swipe, or hover.
- The product responds. A page loads, a menu opens, a confirmation appears, an item lands in the cart.
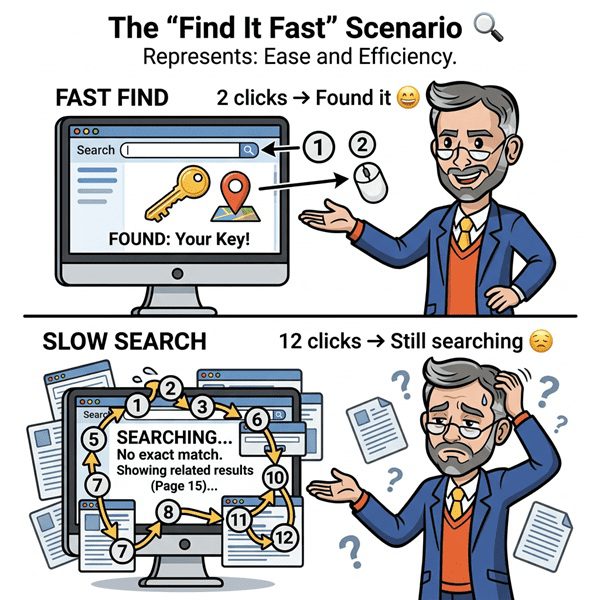
- The user decides what to do next. Clear and fast response? They continue. Confusing or slow? They hesitate or leave.
Step 3 is where speed matters. Nielsen Norman Group describes three response-time limits: about 0.1 seconds feels instant, about 1 second keeps the user’s flow of thought unbroken, and about 10 seconds is the limit for holding their attention. Past that, people drift off.
Common Types of User Interactions
- Clicks and taps: buttons, links, menu items, and each call to action.
- Scrolling: how far down a page people get before they stop.
- Form inputs: typing into fields, picking from drop-downs, ticking boxes.
- Media plays: starting, pausing, and finishing videos or audio.
- Hovers and swipes: mouse-overs on desktop, swipes and pinches on mobile.
- Downloads and shares: grabbing a PDF, sharing a post, copying a link.
How Interactions Are Measured
Most analytics tools record interactions as events. Google Analytics 4, for example, counts a session as “engaged” when it lasts longer than 10 seconds, includes a key event, or has 2 or more page or screen views. The share of sessions that meet that bar is the engagement rate.
Engagement rate = engaged sessions ÷ total sessions
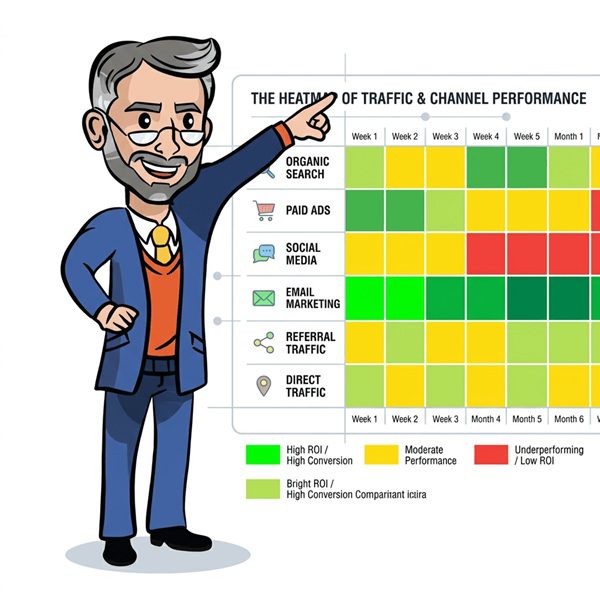
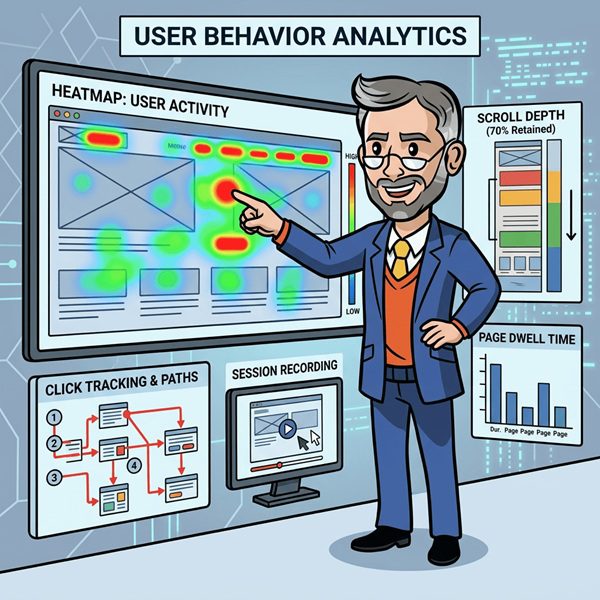
Add a heatmap or session recording and you see not just how many people interacted, but where on the page and where they got stuck.
User Interaction Example
Peak Trail Coffee sells subscription coffee. Its product page gets 1,000 visitors a month. The owner sets up event tracking and finds this path:
| Step | People | Share of previous step |
|---|---|---|
| Land on the page | 1,000 | n/a |
| Scroll to the “Choose Your Roast” selector | 600 | 60% |
| Pick a roast | 300 | 50% |
| Click “Subscribe” | 150 | 50% |
| Complete checkout | 30 | 20% |
The big leak is the last step. A session recording shows why: the checkout form has 14 fields, including a phone number and a “How did you hear about us?” box. On mobile, the “Continue” button sits below the fold.
The owner cuts the form to 7 fields, moves the button up, and adds a progress bar. Next month, 60 of those 150 finish checkout. That’s 40% instead of 20%, and 6% of all visitors instead of 3%.
The coffee, the price, and the traffic didn’t change. Only the interactions did. These numbers are made up to show the idea, but the pattern is common: friction adds up, and removing it is usually cheaper than buying more traffic.
Common User Interaction Mistakes
- Looking clickable when it isn’t (or the reverse). Underlined text that isn’t a link, or a button that looks like plain text, confuses people. Keep one consistent style for everything clickable and test it with real users.
- Asking for too much in forms. Baymard Institute found the average checkout had 11.3 form fields in 2024, while most sites need only about 8. Cut every field you don’t need to complete the sale.
- Giving no feedback after an action. If someone clicks “Submit” and nothing visibly happens, they click again or leave. Show loading indicators, confirmations, and error messages that say how to fix the problem.
- Designing only for desktop. Hover menus, tiny tap targets, and buttons below the fold break on phones. Test every key path on a real mobile device before launch.
Next Step
Want help finding the friction points in your funnel? Book your free strategy session with Sales Funnel Professor.
User Interaction FAQs
What are examples of user interaction?
Common examples are clicking a button, scrolling a page, typing into a form, playing a video, adding a product to a cart, opening a menu, and swiping through images on a phone. In marketing, the ones that matter most lead toward a conversion, like clicking a call to action or submitting a lead form.
What is the difference between user interaction and user experience?
User interaction is the individual action and the response, like a click and the page that loads after it. User experience (UX) is the overall outcome across all of those interactions. Good interactions are the building blocks of good UX, but UX also covers content, speed, trust, and support.
What is the difference between user interaction and user engagement?
Interaction is a single, specific action, like a click or a scroll. Engagement is the bigger picture: how invested someone is over time, through repeat visits, time spent, and involvement with your brand. Interactions are the raw data. Engagement is what you conclude from them.
How do you measure user interaction?
Set up event tracking in a tool like Google Analytics 4 to record clicks, scrolls, form submissions, and video plays. Then add heatmaps and session recordings to see where people click and where they get stuck. Watch engagement rate, interaction rate, and conversion rate at each step of the funnel.
Why does user interaction matter for sales?
Every online sale happens through a chain of interactions. If any link is confusing or slow, people drop out before they buy. Improving interactions raises conversion rates without extra ad spend, which makes it one of the most cost-effective ways to grow revenue. It also feeds lead scoring, since interaction data shows buying intent.
Related Terms
- User Interface (UI): the buttons, menus, and screens users interact with. Understand UI before you try to improve interactions.
- User Experience (UX): the bigger picture that user interactions add up to, covering how people feel across the whole journey.
- Event Tracking: the analytics method that records each user interaction so you can measure it.
- Interaction Rate: the share of people who interacted with your content or ad.
- Heatmap: a visual tool that shows where users click, scroll, and hover.
- Conversion Rate Optimization (CRO): the next step after measuring interactions: testing changes that turn more of them into sales.