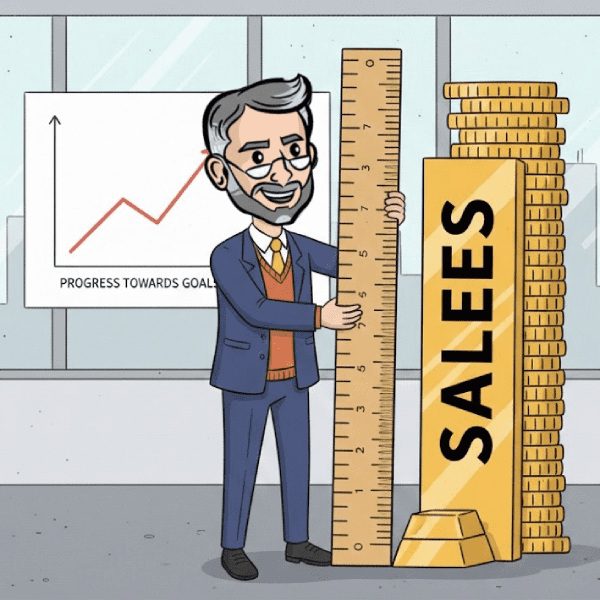
Definition: Sales metrics are the key data points businesses use to measure sales performance, track progress, and identify areas for improvement. They provide insights into how effectively a sales team converts leads, generates revenue, and retains customers. Common sales metrics include conversion rate, average deal size, win rate, sales cycle length, and customer acquisition cost (CAC).
Use it in a Sentence: The sales manager reviewed core sales metrics like pipeline value and close rate to forecast monthly revenue more accurately.
Key Components of Sales Metrics
- Revenue Metrics: Track total sales, average deal size, and monthly recurring revenue (MRR).
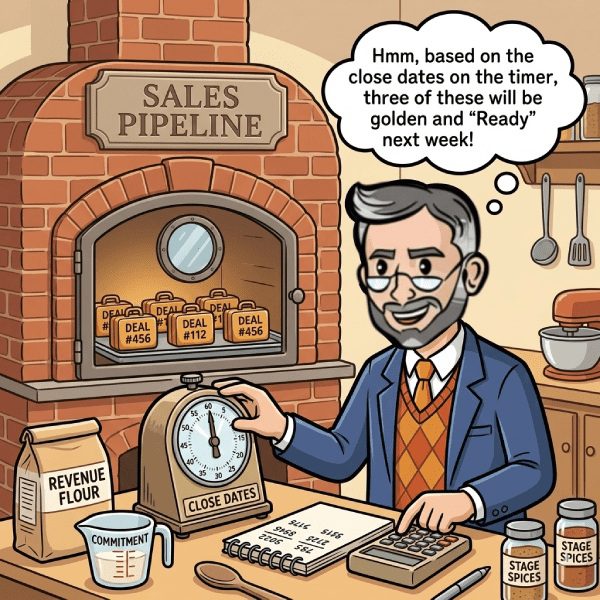
- Pipeline Metrics: Measure the number of open deals, deal value, and velocity.
- Activity Metrics: Monitor calls, emails, demos, and meetings held.
- Efficiency Metrics: Analyze metrics like CAC, sales cycle length, and cost-per-sale.
- Rep Performance Metrics: Evaluate quota attainment, lead response time, and deal close rate.

Why Sales Metrics Matter
- Informs Data-Driven Decisions: Helps managers adjust tactics based on real performance.
- Forecasts Revenue Accurately: Metrics support realistic pipeline projections.
- Reveals Bottlenecks: Identifies weak points in the funnel or sales process.
- Boosts Accountability: Creates transparency across individual and team contributions.
How to Track and Optimize Sales Metrics
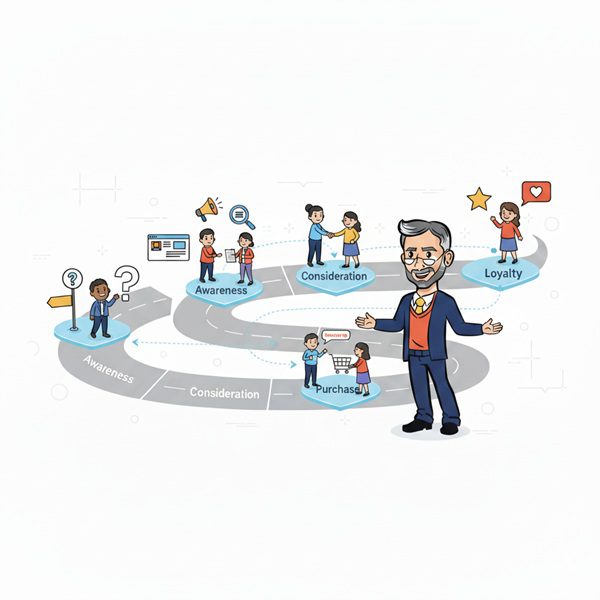
- Choose the Right KPIs: Align metrics with business goals and funnel stages.
- Integrate Data Sources: Pull from CRM, marketing automation, and finance platforms.
- Set Benchmarks: Compare current performance to historical data or industry standards.
- Visualize in Dashboards: Use tools like Salesforce, HubSpot, or Looker to track progress in real time.
- Review Regularly: Analyze trends weekly or monthly and adjust strategies accordingly.
Use Metrics to Supercharge Your Funnel
Our Sales Funnel course teaches you how to select, track, and interpret sales metrics for maximum performance. Learn how to turn numbers into actionable growth.
More Definitions
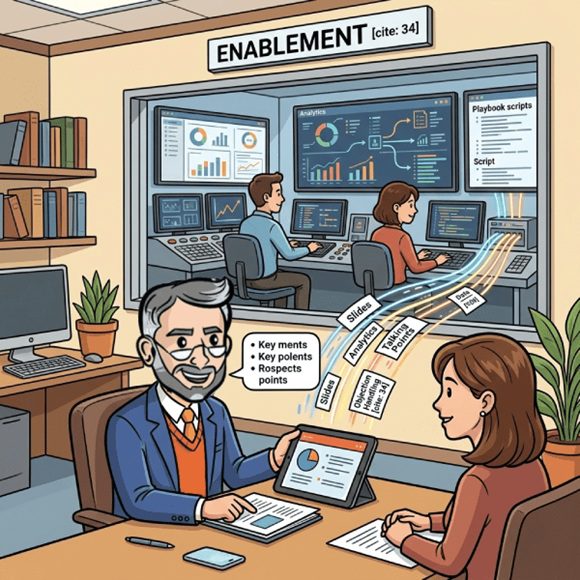
- Sales Dashboard: A visual tool for monitoring sales performance and metrics in real-time.
- Sales Sequence: A series of touchpoints designed to engage prospects and move them through the sales funnel.
- Sales Qualification: The process of determining if a lead is a good fit based on specific criteria.
- Sales Process Mapping: Visually outlining the stages and steps involved in the sales cycle.
- Sales Pipeline Automation: Using technology to manage and advance deals through the pipeline.
- Perplexity Definition: Perplexity measures how well an AI model predicts text.
Useful Blogs
- CRM Data Tracking for Your Sales Funnel: Explains how to collect and manage sales performance data.
- The Marketing Funnel: Stages, Strategies, & How to Optimize: Helps align sales metrics with funnel stages.
- Building a B2B Sales Funnel: The Step-by-Step Guide: Shows how to set measurable goals throughout your sales funnel.
- Learn How Weighted Funnels Can Help Your Business: Provides a framework for advanced sales metrics tracking.
- What Is a Funnel Builder?: Introduces tools that help visualize and manage sales KPIs.