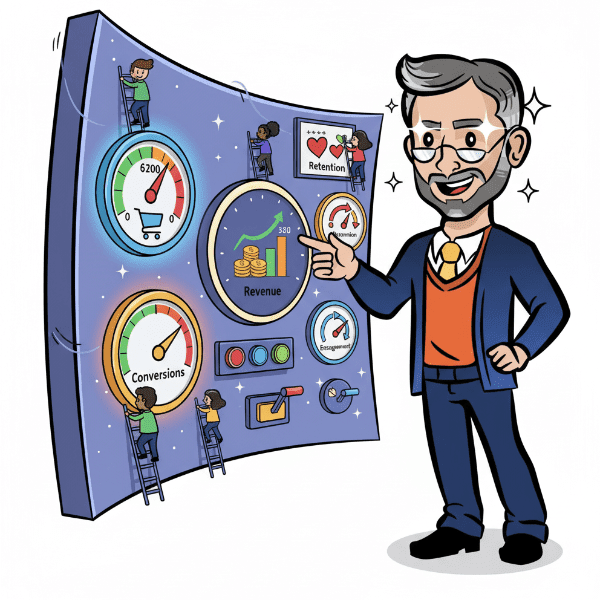
Definition: A sales dashboard is a visual reporting tool that displays key sales metrics, performance data, and trends in real time. It helps teams track progress toward goals, monitor pipelines, and identify areas for improvement. Sales dashboards often include data on revenue, lead conversion rates, deals closed, and sales forecasts, allowing managers to make informed decisions quickly.
Use it in a Sentence: The sales manager reviewed the team’s sales dashboard to track monthly revenue and spot which reps were exceeding their targets.
Key Components of a Sales Dashboard
- Real-Time Data Visualization: Charts, graphs, and tables that update as sales activity occurs.
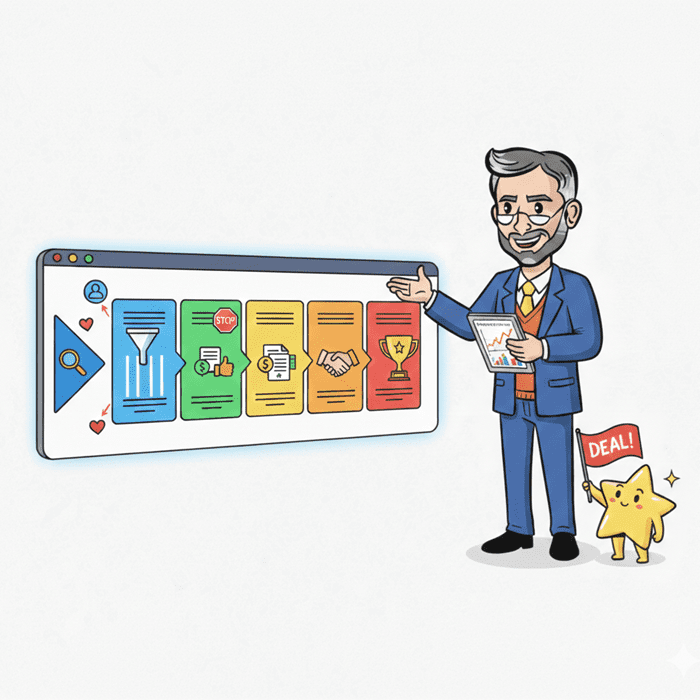
- Pipeline Metrics: Track deal stages, pipeline volume, and velocity.
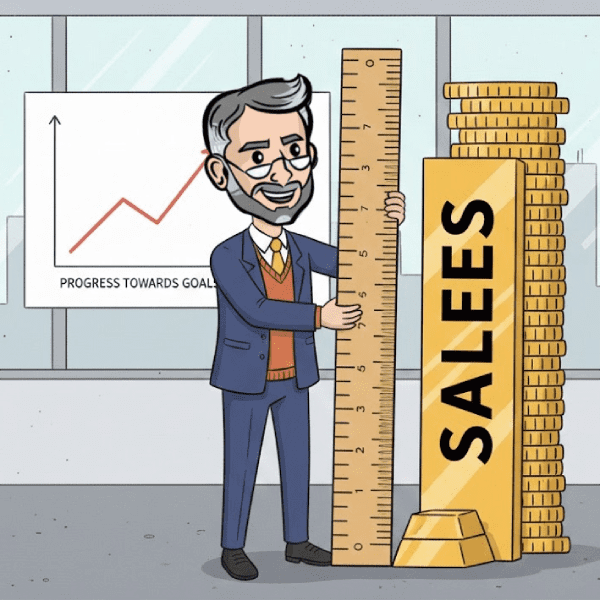
- Revenue & Goal Tracking: Compare actual sales to targets.
- Sales Rep Performance: Evaluate activity levels, close rates, and average sales cycle.
- Lead Source Breakdown: Identify which channels and campaigns generate the best leads.
")
Why Sales Dashboards Matter
- Improves Visibility: Centralizes key data points for faster decision-making.
- Increases Accountability: Empowers reps and managers to track performance and hit goals.
- Enhances Forecast Accuracy: Real-time metrics help project future outcomes.
- Supports Coaching & Optimization: Reveals trends and gaps that can be addressed proactively.
How to Build an Effective Sales Dashboard
- Define Your KPIs: Choose metrics that align with business goals.
- Integrate Data Sources: Connect your CRM, marketing automation, and finance tools.
- Choose the Right Tools: Use platforms like HubSpot, Salesforce, Google Data Studio, or Looker.
- Design for Usability: Keep it clean, clear, and focused on action.
- Review & Optimize Regularly: Reassess dashboard effectiveness as goals evolve.
Master Sales Monitoring with Our Funnel Training
Our Sales Funnel course includes templates and strategies for building high-impact dashboards. Learn how to measure what matters and use visual data to drive growth.
More Definitions
- Analytics Dashboard: A tool that displays key business data in a visual format, aiding in tracking progress and making informed decisions.
- Data Visualization: The process of representing data through visual elements like charts and graphs to simplify complex information.
- Data Aggregation: Combining data from various sources into a cohesive dataset for comprehensive analysis.
- Tableau: A data visualization tool that transforms raw data into interactive and insightful visual representations.
- Buyer Persona: A detailed profile of a target customer, helping businesses tailor their strategies to meet specific needs and behaviors.
Useful Blogs
- The Marketing Funnel: Stages, Strategies, & How to Optimize: Helps align marketing efforts with real-time sales data.
- CRM Data Tracking for Your Sales Funnel: Covers how to collect, manage, and visualize data effectively.
- Learn How Weighted Funnels Can Help Your Business: Introduces performance models that work well in dashboards.
- Building a B2B Sales Funnel: The Step-by-Step Guide: Demonstrates how to set funnel KPIs that integrate into dashboards.
- What Is a Funnel Builder?: Explores tools that assist with dashboard creation and funnel architecture.
- Inside Sales Meaning: How It Compares to Outside Sales and When to Use Each: Learn what inside sales really mean