Understanding Data Visualization
Data visualization refers to the process of displaying data in visual formats—such as charts, graphs, and maps—to help people understand complex information at a glance. It transforms raw datasets into visual stories that highlight trends, comparisons, and key performance indicators (KPIs) in a digestible way.
Example in a Sentence:
The team used data visualization to present lead conversion metrics in a dashboard, which helped executives spot underperforming stages in the funnel.
Why Data Visualization Is Essential
Visualizing data provides strategic advantages across departments. Here’s why:
- Faster Comprehension – Visual content is processed 60,000x faster than text, helping stakeholders digest key metrics quickly.
- Better Decision-Making – Data becomes actionable when presented through graphs, timelines, or charts.
- Real-Time Insight – Dashboards powered by visual data allow live monitoring of campaign performance.
- Cross-Team Alignment – Marketing, sales, and ops teams can rally around shared metrics in an easily understood format.

Key Techniques in Data Visualization
- Bar & Column Charts – Used to compare performance across categories (e.g., leads per channel).
- Line Graphs – Help spot trends over time, such as monthly revenue growth.
- Heatmaps – Show intensity of engagement, clicks, or drop-offs in funnels.
- Pie Charts – Ideal for showing share of traffic, spend, or conversion by source.
- Dashboards – Combine visual widgets into one unified interface for real-time monitoring.
More Definitions
(From the Sales Funnel Professor Encyclopedia)
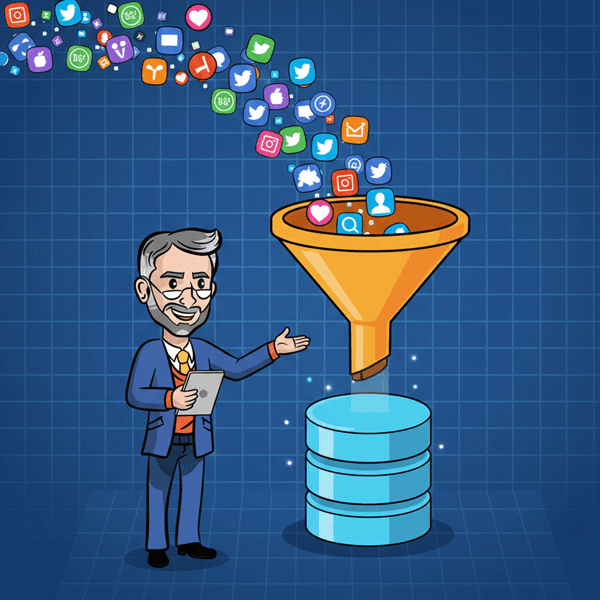
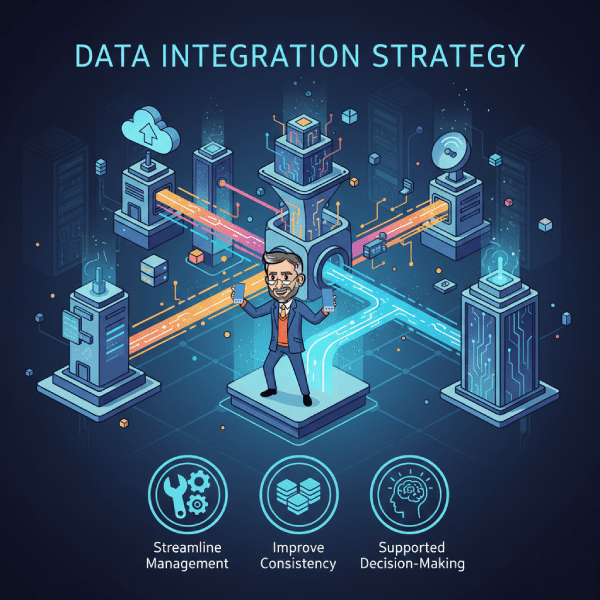
- Data Fusion
The integration of data from multiple sources to produce more complete and accurate insights.
Read more › - Data Mapping
The process of aligning data fields from one system or format to another during migrations or integrations.
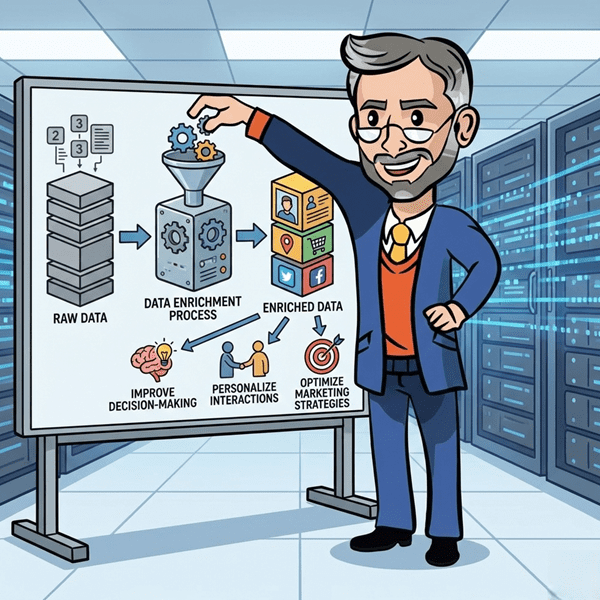
Read more › - Data Enrichment
Enhancing raw data by appending it with additional information from internal or third-party sources.
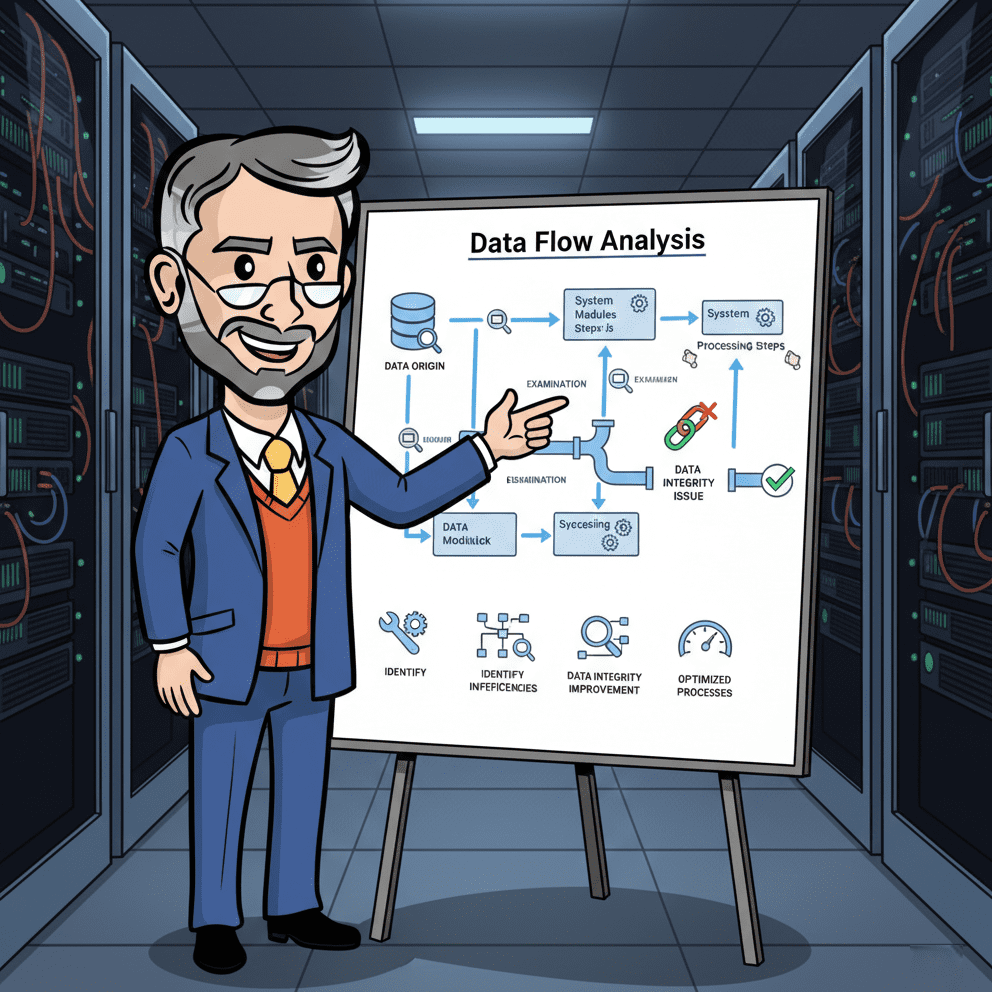
Read more › - Data Flow Analysis
The process of tracing how data moves through a system or funnel to optimize performance.
Read more › - Data Mining
The practice of analyzing large datasets to find patterns, trends, and actionable insights.
Read more › - Data Privacy Regulations
Legal frameworks that govern how businesses collect, store, and use personal data.
Read more › - Data Cleansing Definition
What is data cleansing? Learn how cleaning and standardizing your data improves marketing accuracy, compliance, and performance.
Read more ›
Useful Posts
(From the Sales Funnel Professor Blog)
- Defining Your Bank Marketing Strategy
Discover how financial institutions visualize customer data to create personalized campaigns.
Read more › - Cold Email Mastery: Strategies for Advancing Leads Through Your Sales Funnel
See how metrics and dashboards help optimize cold outreach over time.
Read more ›